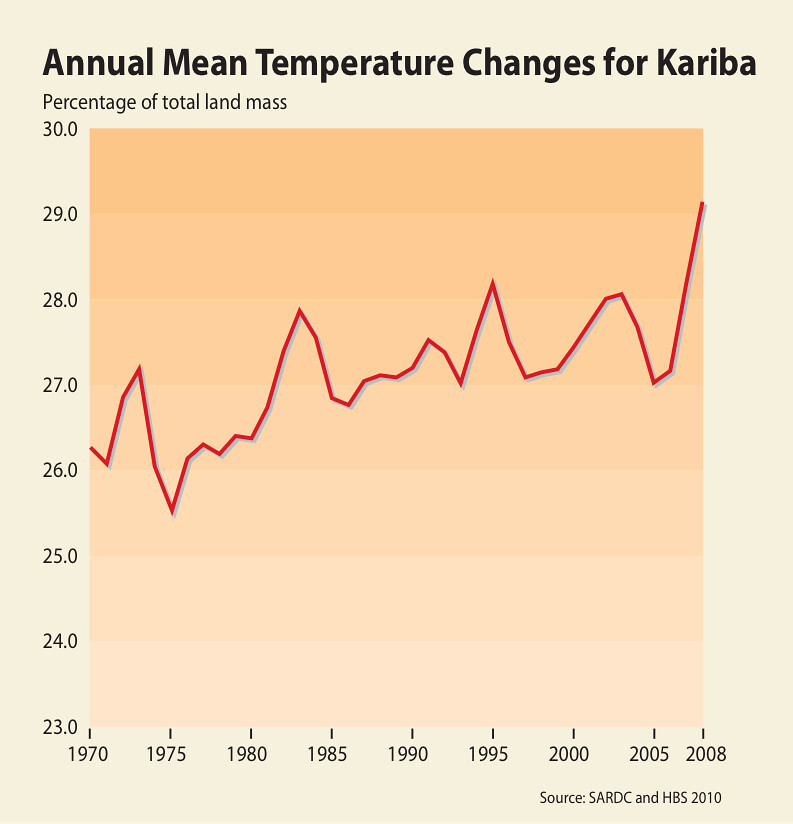
Annual Mean Temperature Changes for Kariba
The Fourth Assessment Report of the IPCC states that global greenhouse gas emissions due to human activities grew by 70% between 1970 and 2004 (IPCC 2009). The emission of greenhouse gases in one region may result in a temperature rise, with associated effects, in another region. Thus the high rate of greenhouse gas emissions across the world is partly the cause of the temperature rise of at least 0.5°C in southern Africa over the past century. Partly as a result of this temperature increase, the 1990s were the warmest and driest years in the Zambezi basin in recent times (SARDC and HBS 2010).
Year: 2013
From collection: Zambezi River Basin - Atlas of the changing Environment
Cartographer: This