We use cookies to imporve your experience. By using our site, you consent to our cookie policy Learn more
arrow arrow_up breadcrumb-chevron-right breadcrumb-home dropdown-arrow-down loader GALogoWUNEP GALogo2018 GALogo2019 menu read-more-plus rrss-email rrss-facebook rrss-flickr rrss-instagram rrss-linkedin rrss-twitter rrss-vimeo rrss-youtube rrss_google_plus rrss_skype rrss_web pdf search share Completed In Process Ideas In Develpment Toogle Toogle Thumbnail View List View play close filter-collapse filter edit media_photo_library media_video_library graphics pictures videos collections next

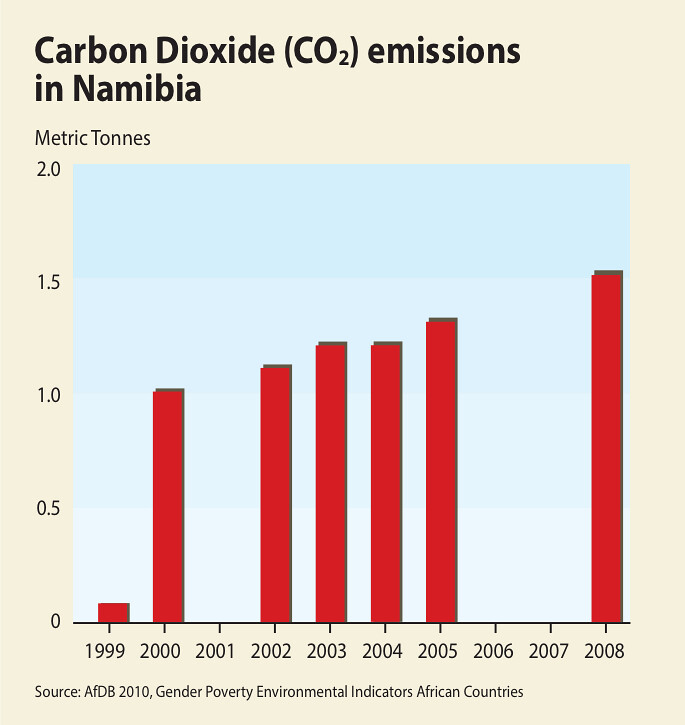
Carbon Dioxide emissions in Namibia

Carbon dioxide emissions have increased slightly since 1999 due to urban growth and increased use of fossil fuels, but the increase shown in the graphic, is largely due to improved monitoring.

Year: 2013

From collection: Zambezi River Basin - Atlas of the changing Environment

Cartographer: This

Tags: Africa Environmental Atlas

Graphics included in same album

View all media

Publications it appears in

View all publications