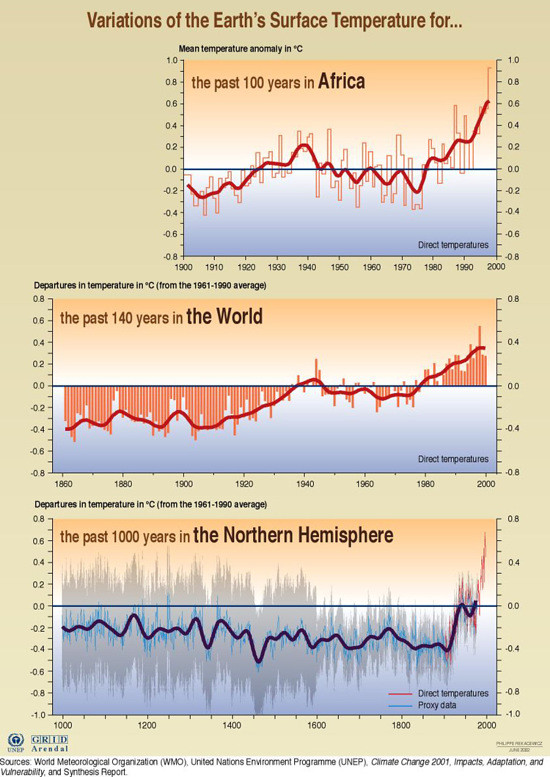
History of variations of the temperature for Africa in relation to the world
Africa is following the global trend of recent increases in temperatures. This resource includes three graphics. The first shows the main temperature anomaly in degrees Celsius in Africa from 1900 to 2000. The second shows departures from the 1961 to 1990 average temperatures, in degrees Celsius, on a global scale for the time period 1860 to 2000. The final graphic shows departures from the 1961 to 1990 temperatures, in degrees Celsius, for the Northern Hemisphere from the year 1000 to the year 2000. The first two graphics are based on direct temperatures, while the third graphic is based on direct temperatures and on proxy data.
Year: 2005
From collection: Vital Climate Graphics Africa
Cartographer: Cartografare il Presente/Nieves Izquierdo