Deforestation in West Africa: Case Cote-d'Ivoire
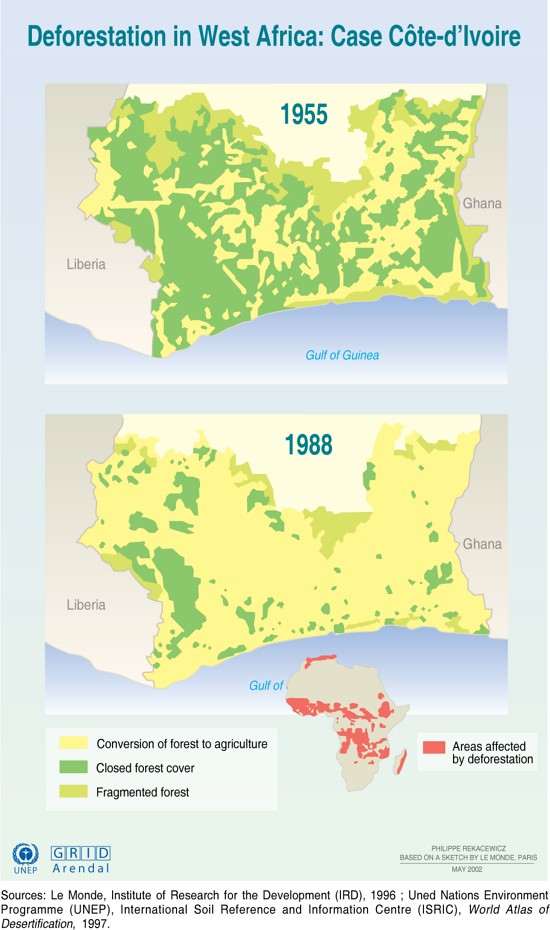
The average annual rate of change in total forest area from 1990 to 2000 for the whole of Africa was estimated to be -0.74 %, equivalent to losing more than 5 million ha of forest a year, an area roughly the size of Togo, and the highest rate of any region. (UNEP: GEO [Global Environment Outlook] 3). This graphic shows how deforestation has occurred in Cote d'Ivoire (the Ivory Coast) by comparing the area's forests in 1955 and in 1988. It shows areas in which forests were converted for agriculture, areas of closed forest cover, and areas of fragmented forest cover. This resource also includes a graphic that shows the areas of Africa that are affected by deforestation.
Year: 2005
From collection: Vital Climate Graphics Africa
Cartographer: Cartografare il Presente/Nieves Izquierdo