We use cookies to imporve your experience. By using our site, you consent to our cookie policy Learn more
arrow arrow_up breadcrumb-chevron-right breadcrumb-home dropdown-arrow-down loader GALogoWUNEP GALogo2018 GALogo2019 menu read-more-plus rrss-email rrss-facebook rrss-flickr rrss-instagram rrss-linkedin rrss-twitter rrss-vimeo rrss-youtube rrss_google_plus rrss_skype rrss_web pdf search share Completed In Process Ideas In Develpment Toogle Toogle Thumbnail View List View play close filter-collapse filter edit media_photo_library media_video_library graphics pictures videos collections next

The Melting Snows of Kilimanjaro

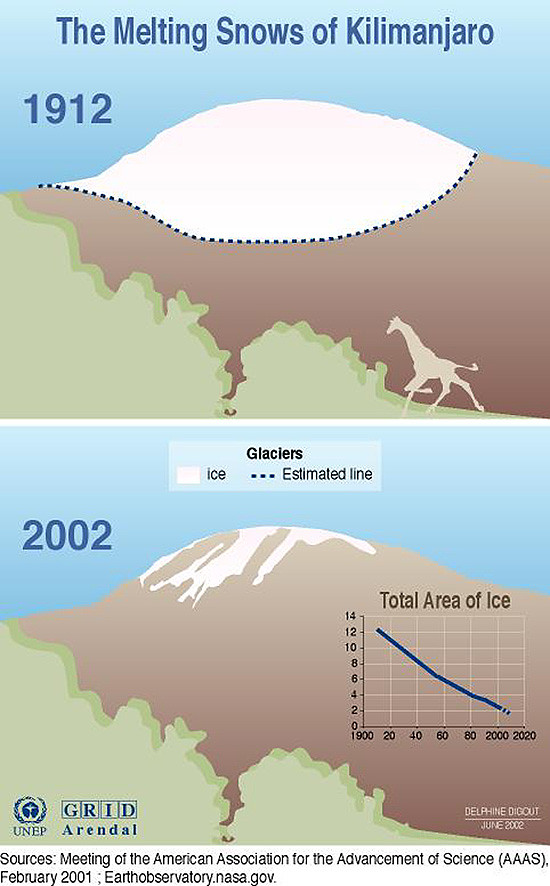
At the February 2001 meeting of the American Association for the Advancement of Science (AAAS), researchers reported dramatic changes in the volume of ice capping the Kibo summit of Kilimanjaro.This graphic shows the estimated extent of the glacier on Mount Kilimanjaro in 1912, and the extent of the glaciers there in 2002. The graphic also shows the decline in the total area of the ice from 1900 to 2000, with projected data to the year 2020.

Year: 2005

From collection: Vital Climate Graphics Africa

Cartographer: Cartografare il Presente/Nieves Izquierdo

Graphics included in same album

View all media

Publications it appears in

View all publications