We use cookies to imporve your experience. By using our site, you consent to our cookie policy Learn more
arrow arrow_up breadcrumb-chevron-right breadcrumb-home dropdown-arrow-down loader GALogoWUNEP GALogo2018 GALogo2019 menu read-more-plus rrss-email rrss-facebook rrss-flickr rrss-instagram rrss-linkedin rrss-twitter rrss-vimeo rrss-youtube rrss_google_plus rrss_skype rrss_web pdf search share Completed In Process Ideas In Develpment Toogle Toogle Thumbnail View List View play close filter-collapse filter edit media_photo_library media_video_library graphics pictures videos collections next

Climate Change in Zimbabwe

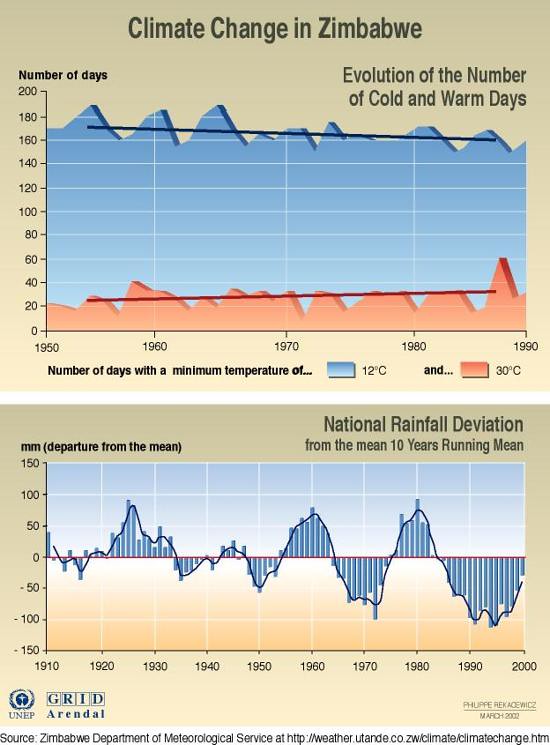
Zimbabwe is experiencing more hot days and fewer cold days, and the amount of precipitation it receives is deviating from the mean more frequently. This resource includes two graphics. The first shows the number of days with a minimum temperature of 12 degrees Celsius and the number of days with a minimum temperature of 30 degrees Celsius from 1950 to 1990. The second graphic shows the amount of precipitation in millimetres that was a departure from the long-term mean amount for the time period 1910 to 2000.

Year: 2005

From collection: Vital Climate Graphics Africa

Cartographer: Cartografare il Presente/Nieves Izquierdo

Graphics included in same album

View all media

Publications it appears in

View all publications