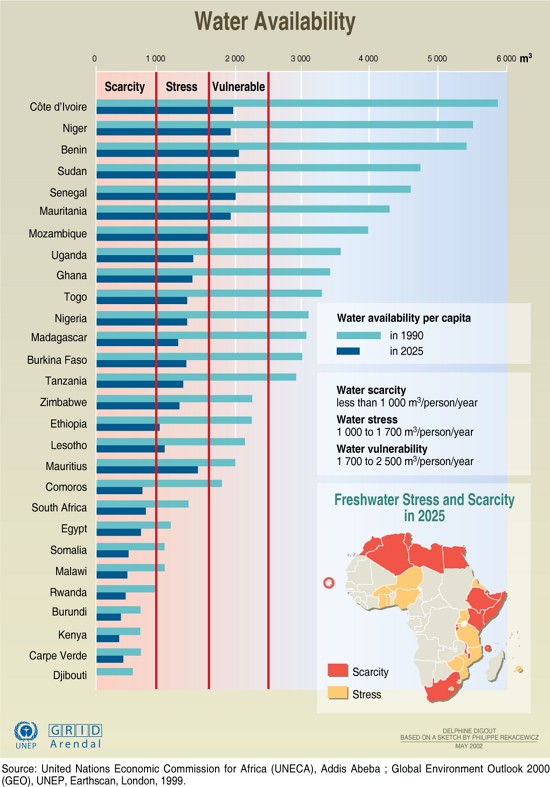
Water Availability in Africa
Water resources are inextricably linked with climate, so the prospect of global climate change has serious implications for water resources and regional development (Riebsame et al., 1995). This graphic shows water availability per capita in cubic metres for selected countries in Africa in 1990, with projected data for 2025. It also shows which countries were affected by water stress, water scarcity and water vulnerability in 1990, with projected data for 2025. This resource also includes a graphic showing which African countries are expected to be affected by freshwater stress and by freshwater scarcity in 2025.
Year: 2005
From collection: Vital Climate Graphics Africa
Cartographer: Cartografare il Presente/Nieves Izquierdo