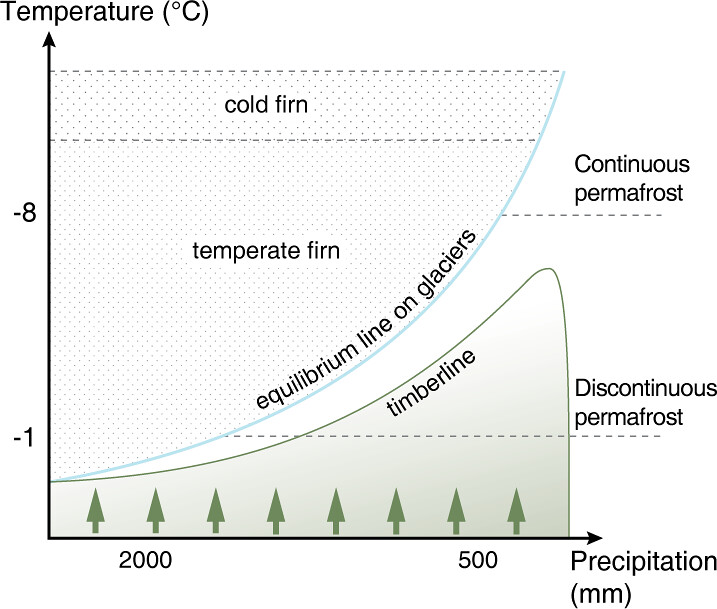
Schematic diagram of glacier, permafrost and forest limits as a function of mean annual air temperature and average annual precipitation
Glaciers and ice caps form around the world where snow deposited during the cold/humid season does not entirely melt during warm/dry times. This seasonal snow gradually becomes denser and transforms into perennial firn (rounded, well-bonded snow that is older than one year) and finally, after the air passages connecting the grains are closed off, into ice. The ice from such accumulation areas then flows under the influence of its own weight and the local slopes down to lower altitudes, where it melts again (ablation areas). Accumulation and ablation areas are separated by an equilibrium line, where the balance between gain and loss in the ice mass is exactly zero. Where glaciers form thus depends not only on air temperature and precipitation, but also on the terrain, which determines how much solar radiation the glacier will receive and where ice and snow will accumulate.
Year: 2016
From collection: Global Outlook for Ice and Snow
Cartographer: Hugo Ahlenius, UNEP/GRID-Arendal