Example of enhanced water levels produced from river ice, Liard River, Canada
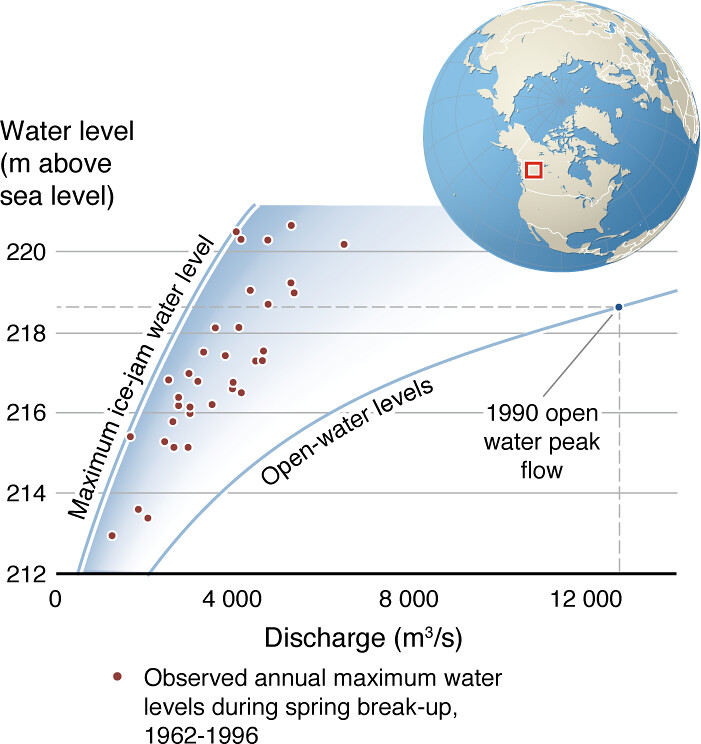
The lower curve shows the correspondence between river flow and water levels under open-water conditions. The much greater maximum water levels possible under ice-jam conditions are illustrated by the upper curve. The transition in break-up severity from dynamic to thermal break-up effects (see text) is depicted by the gradually shaded area between the two curves. Dots are observed annual maximum water levels during the spring break up. The 1990 dashed line shows the maximum recorded flow for the Liard River – but note that the water level corresponding to this peak flow is lower than for many break-up events with much lower flows. Effects of climate on snowmelt runoff and ice characteristics will lead to regional changes in break-up severity and associated frequency and magnitude of ice-induced flooding.
Year: 2016
From collection: Global Outlook for Ice and Snow
Cartographer: Hugo Ahlenius, UNEP/GRID-Arendal