We use cookies to imporve your experience. By using our site, you consent to our cookie policy Learn more
arrow arrow_up breadcrumb-chevron-right breadcrumb-home dropdown-arrow-down loader GALogoWUNEP GALogo2018 GALogo2019 menu read-more-plus rrss-email rrss-facebook rrss-flickr rrss-instagram rrss-linkedin rrss-twitter rrss-vimeo rrss-youtube rrss_google_plus rrss_skype rrss_web pdf search share Completed In Process Ideas In Develpment Toogle Toogle Thumbnail View List View play close filter-collapse filter edit media_photo_library media_video_library graphics pictures videos collections next

Waste as a result of car production

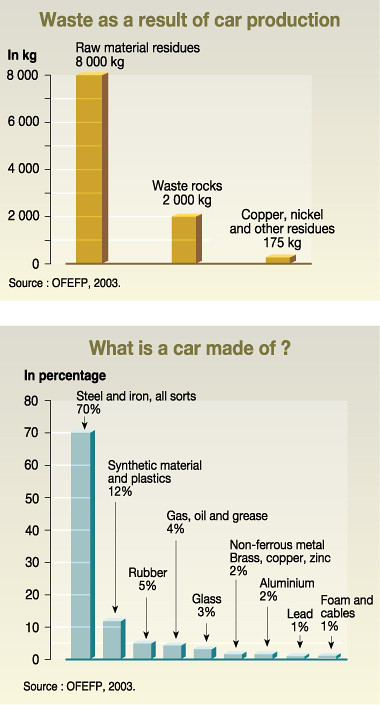
The life cycle approach gives a more complete picture of the waste and energy associated with a product. Our daily choices determine the amount of waste we produce. As consumers, our relationship to a product happens only during a short phase of its existence. This chart reflects the waste material during car production, as well as the distribution of material in a typical car.

Year: 2005

From collection: Vital Waste Graphics

Cartographer: Philippe Rekacewicz, UNEP/GRID-Arendal

Tags: graphics Vital

Graphics included in same album

View all media

Publications it appears in

View all publications