We use cookies to imporve your experience. By using our site, you consent to our cookie policy Learn more
arrow arrow_up breadcrumb-chevron-right breadcrumb-home dropdown-arrow-down loader GALogoWUNEP GALogo2018 GALogo2019 menu read-more-plus rrss-email rrss-facebook rrss-flickr rrss-instagram rrss-linkedin rrss-twitter rrss-vimeo rrss-youtube rrss_google_plus rrss_skype rrss_web pdf search share Completed In Process Ideas In Develpment Toogle Toogle Thumbnail View List View play close filter-collapse filter edit media_photo_library media_video_library graphics pictures videos collections next

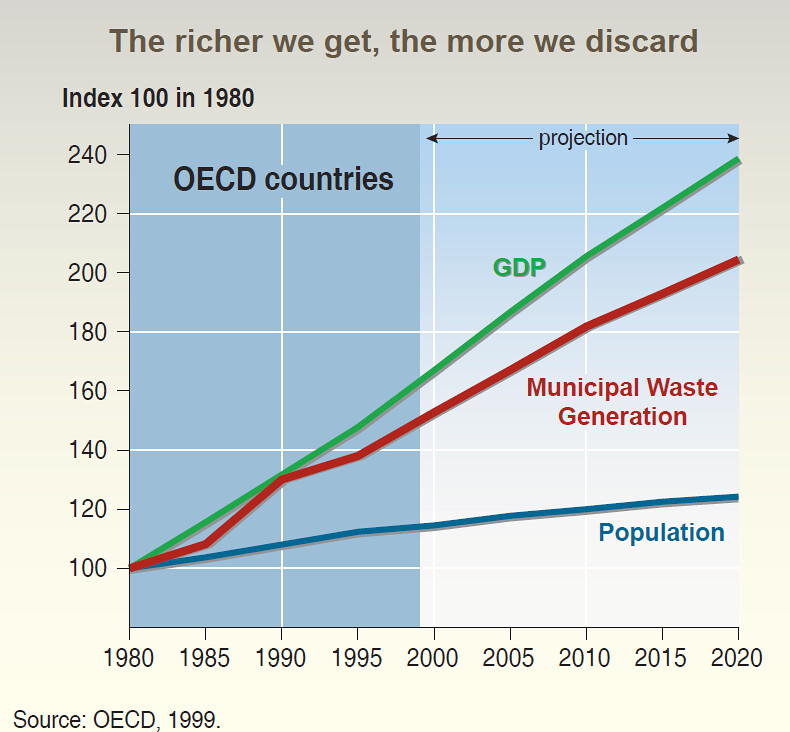
The richer we get, the more we discard

According to various scenarios, the economic development (presented in this graphic as Gross Domestic Product, GDP) will most likely continue for the next decades – but at a slower pace for those countries that can afford advanced waste management strategies. As 1.3 billion Chinese thunder into the great pleasures of consumption, municipal waste is certainly a major environmental concern.

Year: 2005

From collection: Vital Waste Graphics

Cartographer: Philippe Rekacewicz, UNEP/GRID-Arendal

Tags: graphics Vital

Graphics included in same album

View all media

Publications it appears in

View all publications