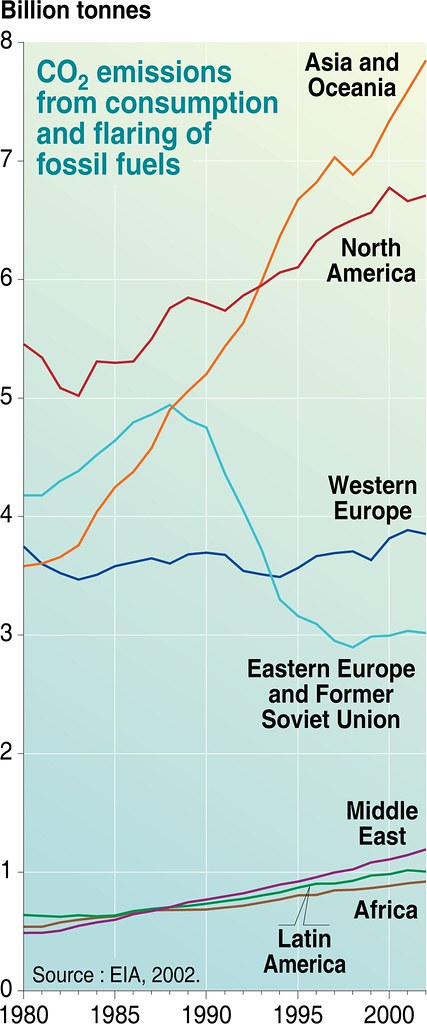
CO2 emissions from consumption and flaring of fossil fuels
A line graph showing the progress of CO2 emissions created from consumption and flaring of fossil fuels from 1980 to 2002. Indicates that Eastern Europe and Former Soviet Union is the only region to have a reduction. Emissions are not usually monitored directly, but are generally estimated using models. Some emissions can be calculated with only limited accuracy. Emissions from energy and industrial processes are the most reliable (using energy consumption statistics and industrial point sources).
Year: 2005
From collection: Vital Climate Change Graphics Update
Cartographer: Philippe Rekacewicz, Emmanuelle Bournay, UNEP/GRID-Arendal