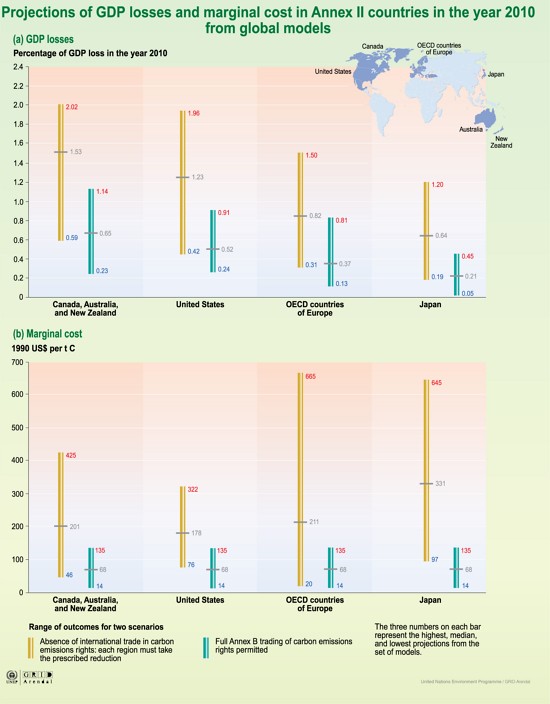
Projections of GDP losses and marginal cost in Annex II countries in the year 2010 from global models
The Kyoto Protocol is only a first step towards combating climate change. Drastic reductions of greenhouse gas emissions are required to avoid the most threatening consequences of global warming. Concerns are raised that the price for the economy will be too high, but studies indicate that there will only be a small reduction in GDP to reach the Kyoto targets and that it is possible to stabilize the concentration of CO2 at low costs. The GDP loss in OECD countries of Europe will in 2010, be 0.13–0.81% if carbon trading is implemented. If carbon trading is not implemented, the loss will be 0.31–1.50%. For the US the loss would be 0.42–1.96% if carbon trading is not implemented and 0.24–0.91% if it is implemented. For most economies in transition, GDP effects range from negligible to a several percent increase, reflecting opportunities for energy-efficiency improvements not available to other Annex I countries. Under assumptions of drastic energy-efficiency improvement and/or continuing economic recessions in some countries, the assigned amounts may exceed projected emissions in the first commitment period. In this case, models show increased GDP due to revenues from trading assigned amounts. However, for some economies in transition, implementing the Kyoto Protocol will have similar impact on GDP as for other Annex I countries.
Year: 2005
From collection: Vital Climate Change Graphics Update
Cartographer: Philippe Rekacewicz, Emmanuelle Bournay, UNEP/GRID-Arendal