Indus basin climate indicators – Rainfall & Temperature
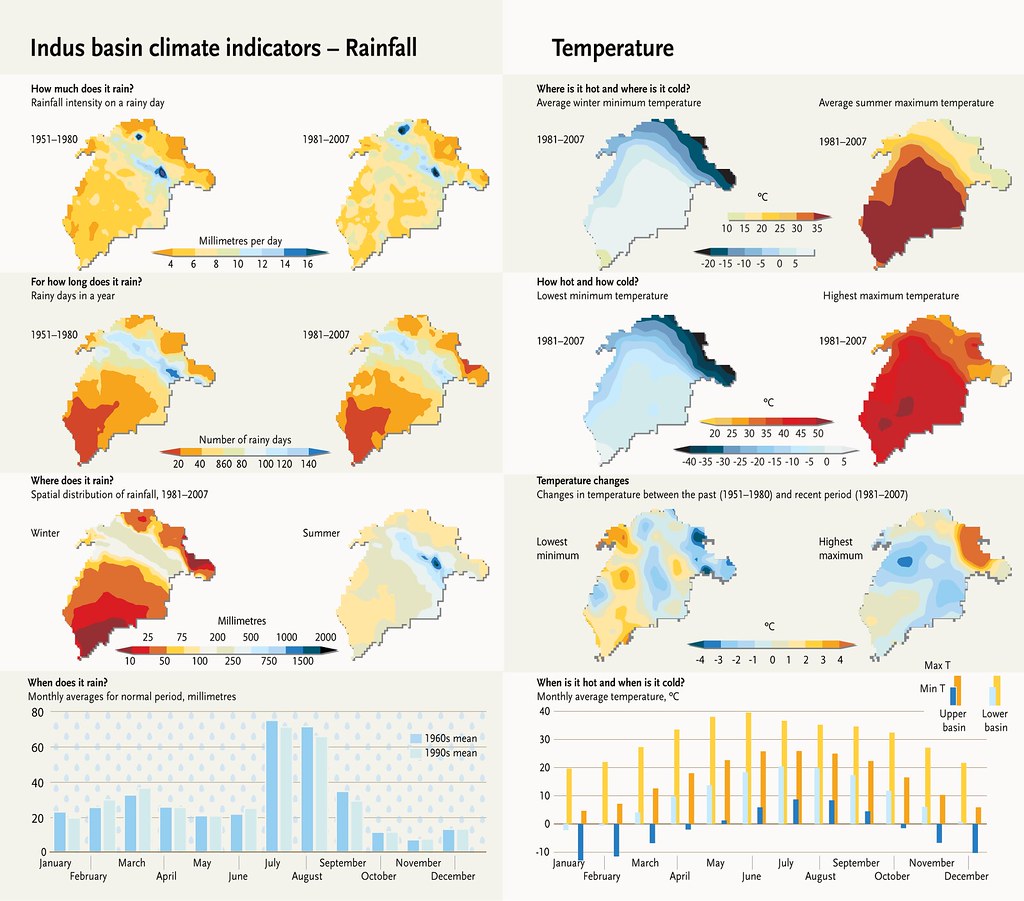
Rainfall: Overall, the upper basin receives more precipitation than the lower basin and plays an important role in water availability in the whole basin throughout the year. Within the upper basin, the main mountain range is important, because it receives the most precipitation and of the highest intensity, both of which are showing increasing trends. The average annual precipitation in the Indus basin is 365 mm, although the variation across the basin is considerable, particularly between the upper and lower basins. The upper Indus receives nearly 500 mm, whereas the lower basin receives just under 300 mm. The highest annual precipitation occurs along the main mountain range in the upper basin, which can reach up to 3,000 mm in some areas. The lowest precipitation (lower than 100 mm) occurs within the lower basin and northeastern parts of the upper basin. Overall, the upper basin experiences 132 rainy days a year, compared to 84 days in the lower basin. Fifty-five per cent of precipitation falls during the monsoon season. However, compared to the other basins, winter precipitation also plays an important role. Winter contributes 17% of the total annual precipitation for the whole basin and as much as 30% in the upper basin. Summer precipitation has decreased over a large part of the basin, particularly over the southern slopes of the main mountain range, and especially in the east where the highest (maximum) rainfall is observed. Winter precipitation has increased overall, but with the exception of some parts of the upper basin towards the northeast. Contrary to general climate trends, rainfall variability was greater during the 1960s and has decreased slightly in recent years. Temperature: Over the past decades and across the basin, winters are getting warmer, but summers are getting cooler. However, extreme hot days are getting hotter and extreme cold days are getting milder. Across the Indus basin, the average maximum temperature is about 30°C in summer and 13°C in winter. Average minimum temperatures range from 18°C in summer to –0.3°C in winter. The coldest month is January and the warmest is June. The average temperature has shown an increasing trend, driven mainly by increases in winter temperatures, and more prominently since the 1980s. Average maximum temperatures have slightly decreased (0.5°C), while minimum temperatures have increased (1.2°C) in the winter. Average minimum temperatures have increased in both seasons. The extreme maximum temperature is increasing most prominently over the upper basin, whereas the trend is decreasing over the lower basin (except for a large area in the southwest). The extreme minimum temperature is decreasing over the central part and in a small area over the northeast and southwest; elsewhere it is on the rise with the highest severity over the north and west.
Year: 2015
From collection: The Himalayan Climate and Water Atlas
Cartographer: Riccardo Pravettoni