Brahmaputra basin climate indicators – Rainfall & Temperature
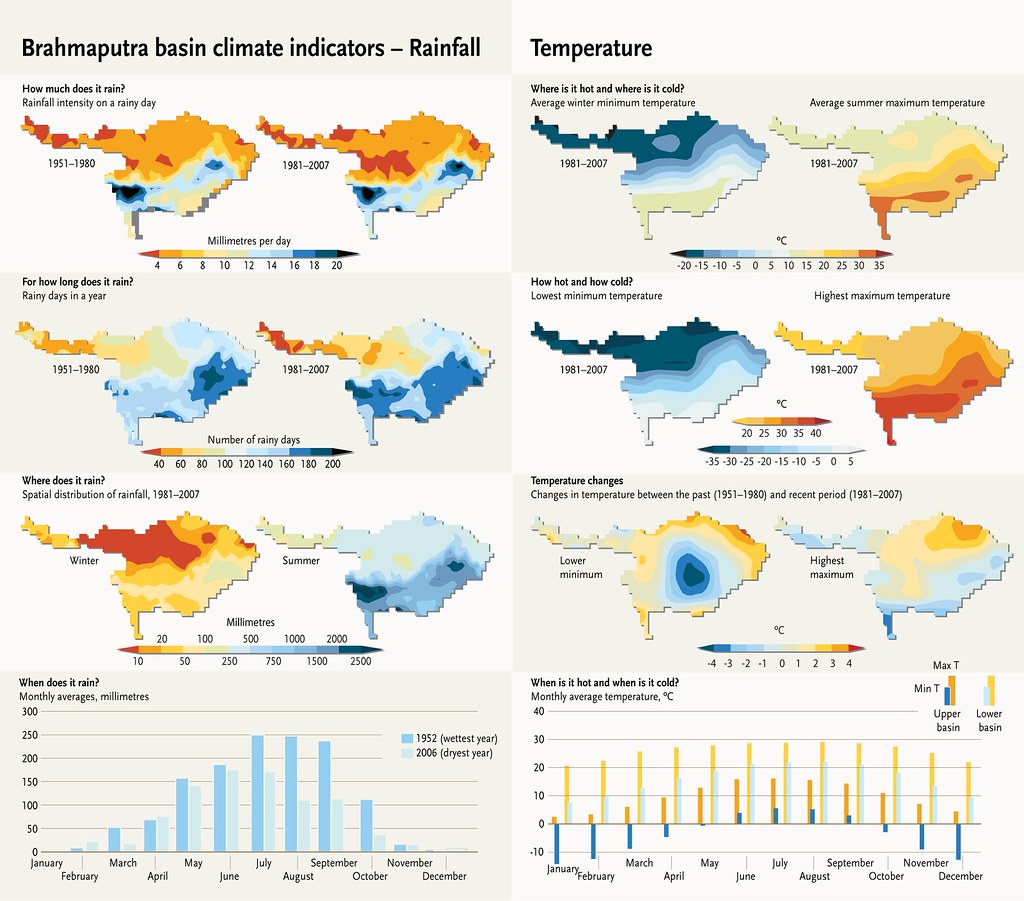
Rainfall: The Brahmaputra basin receives an average of just over 1,100 mm of rain annually. Of the annual total, 70% is received during the monsoon season (June– September) and 20% in the pre-monsoon season. Winter is the driest season. Rainfall distribution varies considerably between the southern and northern parts of the basin. The lower Brahmaputra basin receives approximately 2,216 mm of rain annually, which is over three times more than the upper basin. There are approximately 164 rainy days a year in the upper Brahmaputra and 214 in the lower Brahmaputra basin. Temperature: Over the past decades and across the basin, temperatures are changing over time and showing mixed trends across the seasons and in different areas of the basin. Overall, increasing trends are seen in average winter minimum temperatures, as well as in night-time temperatures. The average maximum temperature in the Brahmaputra basin is 19.6°C in the summer and approximately 9.2°C in the winter. The average minimum temperature is –0.3 °C in winter and 18.3°C in summer (these figures are seasonal averages for June, July, August and September for summer and December, January and February for winter). Minimum temperatures are showing an increasing trend: there has been a significant rise of 0.5°C in average minimum winter temperature across the basin. Within the pre-monsoon and post monsoon, the rise is 0.3°C and 0.4°C, respectively. The temperature in the summer (monsoon) has not changed. Average summer maximums are showing mixed trends across the seasons and in different areas of the basin. Overall, increasing trends are seen in average winter minimum temperatures, as well as in night-time temperatures.
Year: 2015
From collection: The Himalayan Climate and Water Atlas
Cartographer: Riccardo Pravettoni