The Rising Sea: Estimations and Predictions
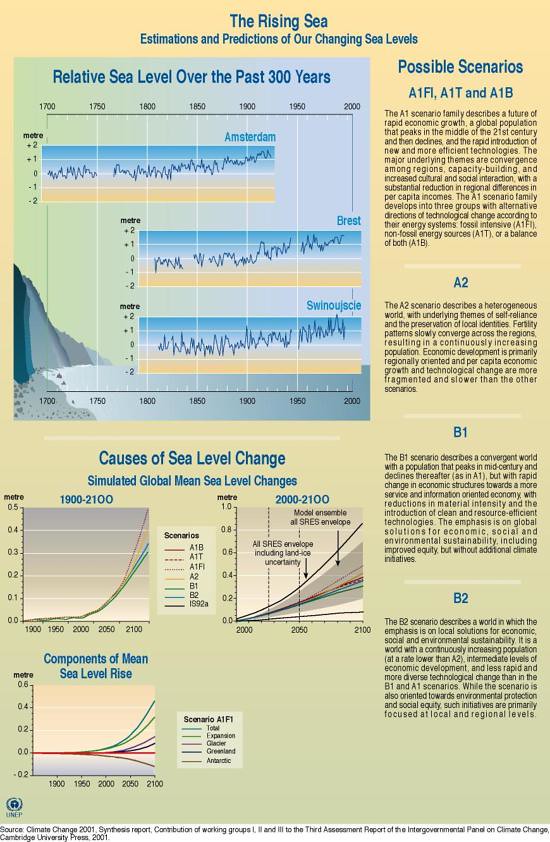
This resource includes four graphics that explain sea level change, an expected consequence of climate change. The first graphic, 'Relative Sea Level Over the Past 300 Years', shows the changes in sea level rise, in metres, that have occurred between 1700 and 2000 at three different locations: Amsterdam, Brest and Swinoujscie (in Poland). The second graphic, 'Causes of Sea Level Change: Simulated Global Mean Sea Level Changes 1900-2100' and the third graphic, 'Causes of Sea Level Change: Simulated Global Mean Sea Level Changes 2000-2100' show the expected changes in global sea level rise, in metres, according to seven different scenarios developed by the Intergovernmental Panel on Climate Change (IPCC). Brief summaries of the scenarios are included. Finally, the fourth graphic in this resource, 'Components of Mean Sea Level Rise', shows how glaciers, Greenland, the Antarctic and other components will contribute to sea level rise by the year 2100 according to Scenario A1F1. (Note: SRES= Special Report on Emissions Scenarios).
Year: 2005
From collection: Vital Water Graphics
Cartographer: GRID-Arendal