We use cookies to imporve your experience. By using our site, you consent to our cookie policy Learn more
arrow arrow_up breadcrumb-chevron-right breadcrumb-home dropdown-arrow-down loader GALogoWUNEP GALogo2018 GALogo2019 menu read-more-plus rrss-email rrss-facebook rrss-flickr rrss-instagram rrss-linkedin rrss-twitter rrss-vimeo rrss-youtube rrss_google_plus rrss_skype rrss_web pdf search share Completed In Process Ideas In Develpment Toogle Toogle Thumbnail View List View play close filter-collapse filter edit media_photo_library media_video_library graphics pictures videos collections next

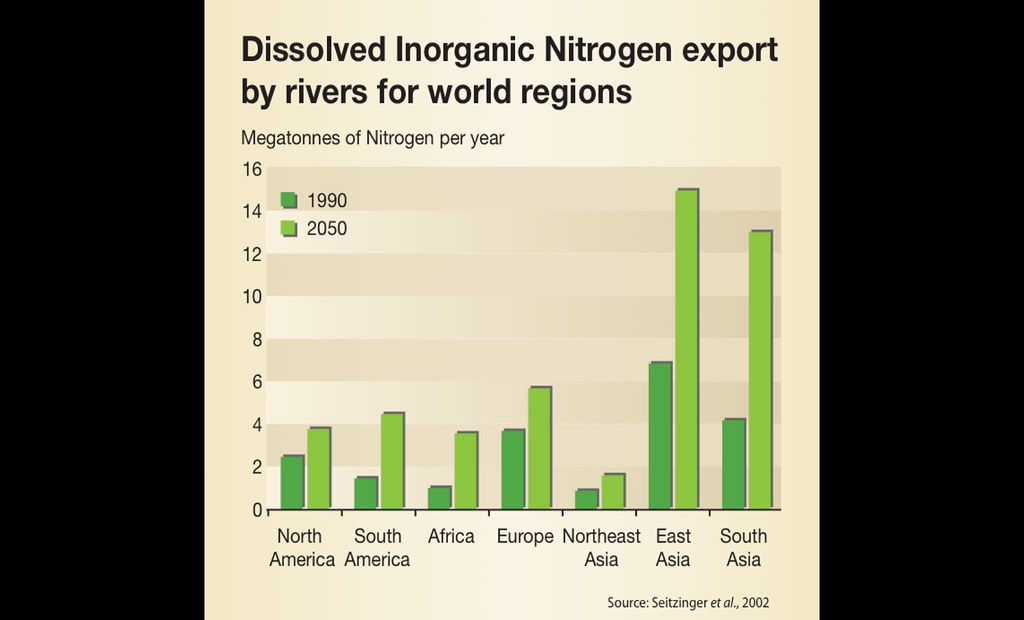
Dissolved Inorganic Nitrogen export by rivers for world regions

The figure shows the amounts of nitrogen exported by rivers per year and provides a forecast for the future.

Year: 2013

From collection: Green Economy in a Blue World - Full Report

Cartographer: GRID-Arendal

Tags: carbon energy

Graphics included in same album

View all media

Publications it appears in

View all publications