We use cookies to imporve your experience. By using our site, you consent to our cookie policy Learn more
arrow arrow_up breadcrumb-chevron-right breadcrumb-home dropdown-arrow-down loader GALogoWUNEP GALogo2018 GALogo2019 menu read-more-plus rrss-email rrss-facebook rrss-flickr rrss-instagram rrss-linkedin rrss-twitter rrss-vimeo rrss-youtube rrss_google_plus rrss_skype rrss_web pdf search share Completed In Process Ideas In Develpment Toogle Toogle Thumbnail View List View play close filter-collapse filter edit media_photo_library media_video_library graphics pictures videos collections next

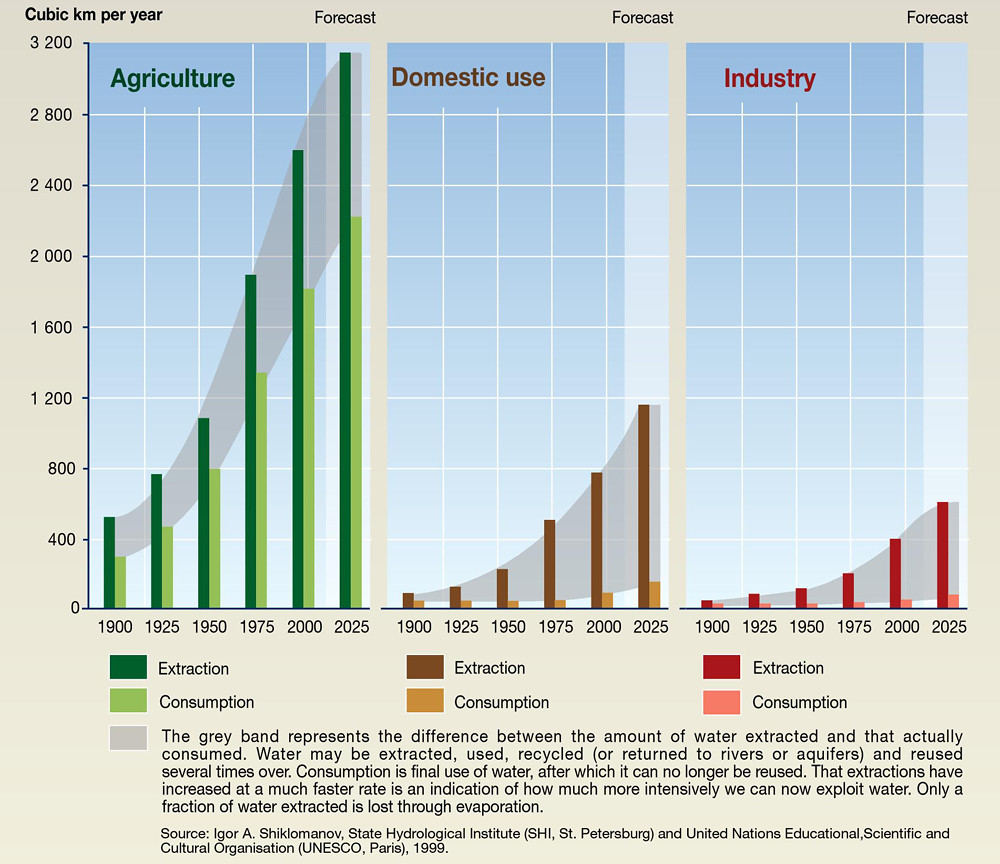
Trends in global water use by sector

The greyband represents in the difference between the amount of water extracted and that actually consumed. Water may be extracted, used, recycled (or returned to rivers or aquifers) and reused several times over. Consumption is final use of water, after which it can no longer be reused. That extractions have increase at a much faster rate is an indication of how much more intensively we can now exploit water. Only a fraction of water extracted is lost through evaporation.

Year: 2009

From collection: Vital Water Graphics 2

Cartographer: Philippe Rekacewicz, February 2006

Graphics included in same album

View all media

Publications it appears in

View all publications