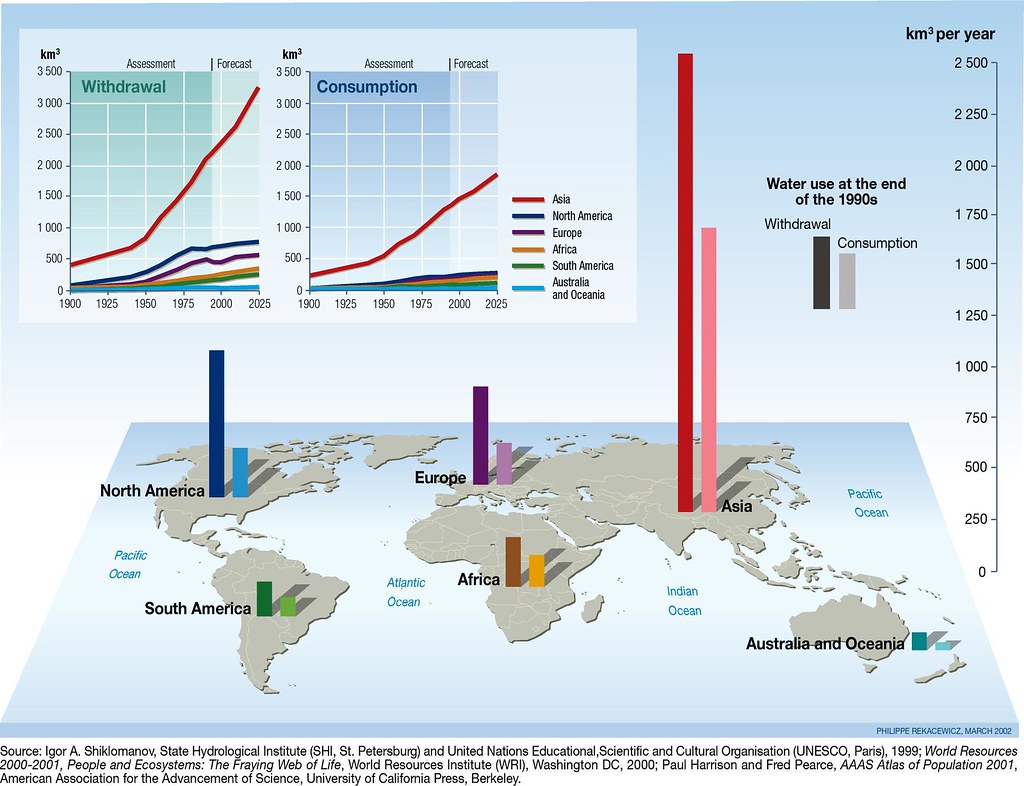
Water withdrawal and consumption: the big gap
Freshwater use by continents is partly based on several socio-economic development factors, including population, physiographic, and climatic characteristics. Analysis indicates that: - Annual global freshwater withdrawal has grown from 3,790 km3 (of which consumption accounted for 2,070 km3 or 61%) in 1995, to 4,430 km3 (of which consumption accounted for 2,304 km3 or 52%) in 2000 (Shiklomanov, 1999). - In 2000, about 57% of the world’s freshwater withdrawal, and 70% of its consumption, took place in Asia, where the world’s major irrigated lands are located (UNESCO, 1999). - In the future, annual global water withdrawal is expected to grow by about 10-12% every 10 years, reaching approximately 5,240 km3 (or an increase of 1.38 times since 1995) by 2025. Water consumption is expected to grow at a slower rate of 1.33 times (UNESCO, 1999). - In the coming decades, the most intensive rate of water withdrawal is expected to occur in Africa and South America (increasing by 1.5-1.6 times), while the least will take place in Europe and North America (1.2 times) (Harrison and Pearce, 2001; Shiklomanov, 1999; UNESCO, 1999).
Year: 2009
From collection: Vital Water Graphics 2
Cartographer: Philippe Rekacewicz, February 2006