Water competition between cities and agriculture
It is estimated that water pollution denies close to 1.3 billion people (20% of the global population in 2000) access to clean water supplies. In 1986, WHO reported that there were 250 million new cases of waterborne diseases each year, causing the deaths of nearly 3.5 million people. An estimated 4.2 billion cases of waterborne diseases are reported each year, with diarrhoea accounting for 4 billion of the total (Cosgrove and Rijsberman, 2000; Revenga et al., 2000). Some 460 million people - more than 8% of the world’s population - live in countries using so much of their freshwater resources that they can be considered highly water stressed (UNCSD, 1999; WMO 1997). A further 25% of the population lives in countries approaching a position of serious water stress (WMO, 1997). An area is experiencing water stress when annual water supplies drop below 1,700 m3 per person. When annual water supplies drop below 1,000 m3 per person, the population faces water scarcity (UNPD, UNEP, World Bank, and WRI, 2000).
Year: 2009
From collection: Vital Water Graphics 2
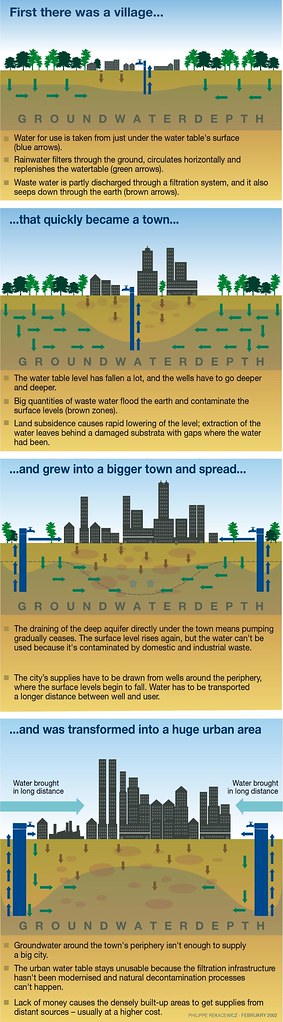
Cartographer: Philippe Rekacewicz, February 2006