Trends in natural disasters
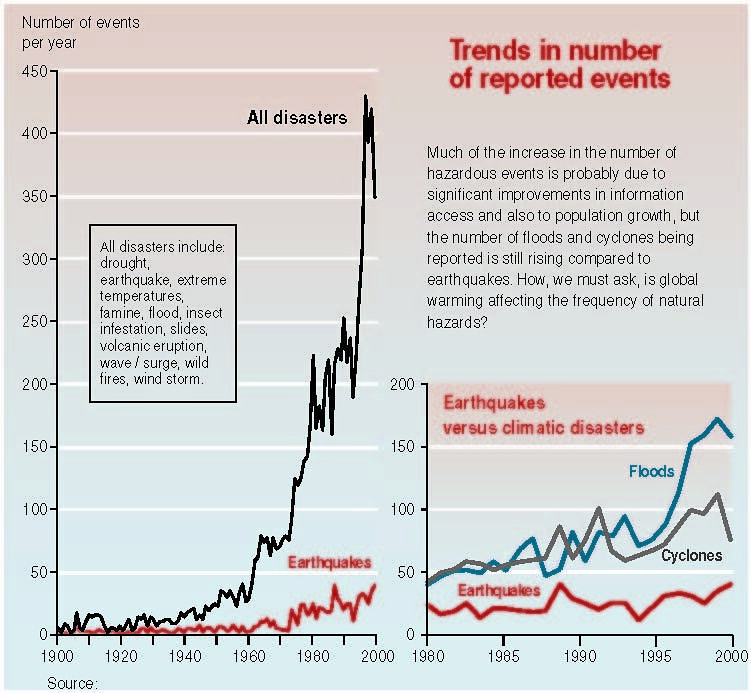
With growing population and infrastructures the world’s exposure to natural hazards is inevitably increasing. This is particularly true as the strongest population growth is located in coastal areas (with greater exposure to floods, cyclones and tidal waves). To make matters worse any land remaining available for urban growth is generally risk-prone, for instance flood plains or steep slopes subject to landslides. The statistics in this graphic reveal an exponential increase in disasters. This raises several questions. Is the increase due to a significant improvement in access to information? What part does population growth and infrastructure development play? Finally, is climate change behind the increasing frequency of natural hazards.
Year: 2006
From collection: Environment and Poverty Times #3: Disaster issue
Cartographer: Emmanuelle Bournay