Average water requirement for biofuels
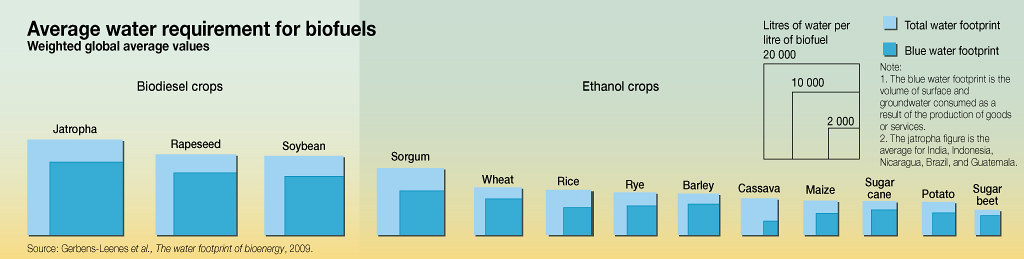
The figure shows average water requirement for biofuels. Underlying data need to be interpreted in context. For example, rainfed jatropha is produced in Mali as a biofuel, which means that it receives less water than in many comparable contexts, but also with somewhat lower output of biofuel. India in contrast, has been irrigating jatropha to achieve commercially acceptable yields. The two contexts will produce different water footprint measurements. Sugarcane is a good example of how these figures might be confusing, because sugarcane is a water-intensive crop but, depending on local conditions, it can have a lower water footprint relative to fuel output.
Year: 2012
From collection: Biofuels Vital Graphics - Powering Green Economy
Cartographer: Riccardo Pravettoni, UNEP/GRID-Arendal