We use cookies to imporve your experience. By using our site, you consent to our cookie policy Learn more
arrow arrow_up breadcrumb-chevron-right breadcrumb-home dropdown-arrow-down loader GALogoWUNEP GALogo2018 GALogo2019 menu read-more-plus rrss-email rrss-facebook rrss-flickr rrss-instagram rrss-linkedin rrss-twitter rrss-vimeo rrss-youtube rrss_google_plus rrss_skype rrss_web pdf search share Completed In Process Ideas In Develpment Toogle Toogle Thumbnail View List View play close filter-collapse filter edit media_photo_library media_video_library graphics pictures videos collections next

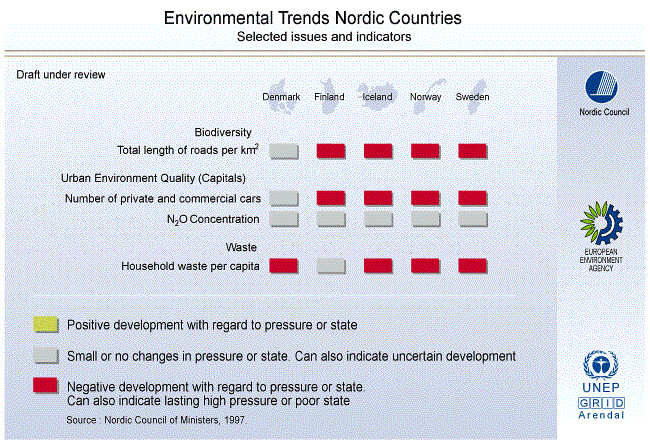
Environmental Trends Nordic countries (part 3)

This illustration shows positive and negative developments in areas such as household waste per capita, urban environment Quality, biodiversity and number of private and commercial cars, see the other illustrations in this collection for more information.

Year: 2006

From collection: Towards an environmentally sustainable Nordic Region

Cartographer: Philippe Rekacewicz

Tags: for graphics Maps presentation

Graphics included in same album

View all media