We use cookies to imporve your experience. By using our site, you consent to our cookie policy Learn more
arrow arrow_up breadcrumb-chevron-right breadcrumb-home dropdown-arrow-down loader GALogoWUNEP GALogo2018 GALogo2019 menu read-more-plus rrss-email rrss-facebook rrss-flickr rrss-instagram rrss-linkedin rrss-twitter rrss-vimeo rrss-youtube rrss_google_plus rrss_skype rrss_web pdf search share Completed In Process Ideas In Develpment Toogle Toogle Thumbnail View List View play close filter-collapse filter edit media_photo_library media_video_library graphics pictures videos collections next

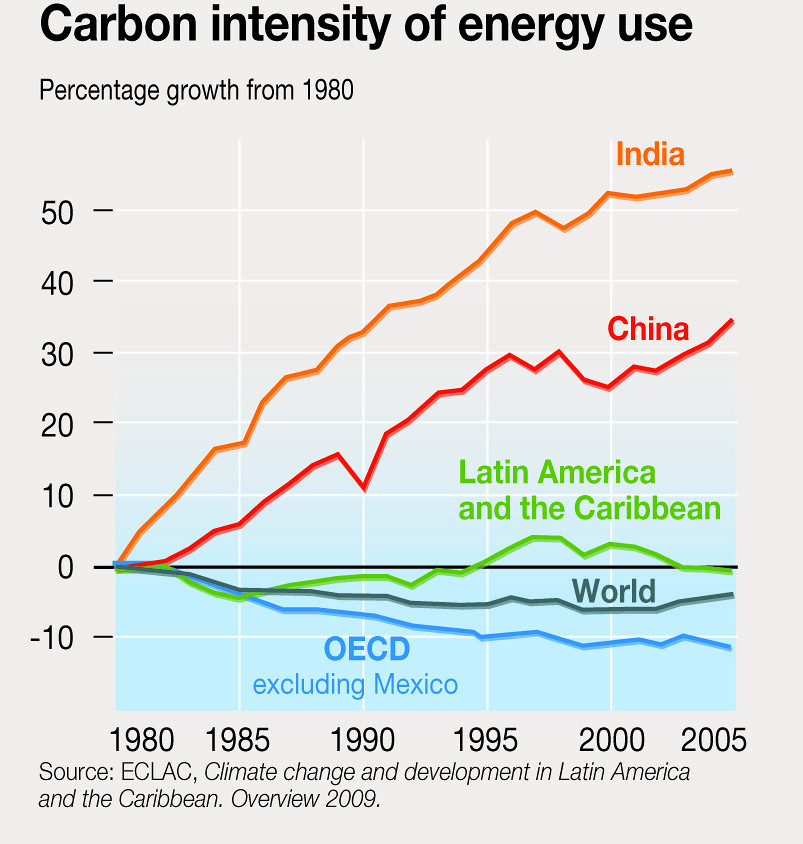
Carbon intensity of energy use: Percentage growth from 1980

By comparing the emissions:energy ratio (carbon intensity) between regions, one finds different patterns over time. Thus, between 1980 and 1995, decarbonization in Latin America and the Caribbean was in line with the world average; in the first half of the 1980s, the region progressed even faster than the OECD countries. Later, between 1995 and 2003, the emissions-to-energy consumption ratio increased.

Year: 2010

From collection: Vital Climate Change Graphics for Latin America and the Caribbean (2010)

Cartographer: Riccardo Pravettoni, UNEP/GRID-Arendal

Graphics included in same album

View all media

Publications it appears in

View all publications