4.4.9. Land-Use Changes
The main driving forces for land-use changes are related to increasing demands
for food because of a growing population and changing diets. In addition, numerous
other social, economic, and institutional factors govern land-use changes, such
as deforestation, expansion of cropland areas, or their re-conversion back to
forest cover (see Chapter 3). Global food production can
be increased, either through intensification (e.g., using multi-cropping, raising
cropping intensity, applying fertilizers, new seeds, improved farming technology)
or through land expansion (e.g., cultivating land, converting forests). Especially
in less developed countries, many examples show the potentials for intensification
of food production in a more or less ecological way that may not lead to higher
GHG emissions (e.g., multi-cropping; agro-forestry).
Different assumptions on these processes translate into alternative scenarios
of future land-use changes and GHG emissions, most notably CO2 , methane (CH4), and nitrous oxide (N2O). A distinguishing characteristic of several models
(e.g., AIM, IMAGE, MARIA, and MiniCAM) used in SRES is the explicit modeling
of land-use changes from expanding biomass uses, and hence exploration of possible
land-use conflicts between the energy and agricultural sectors. The corresponding
scenarios of land-use changes are summarized in Table 4-17 and Figure
4-12 for the four SRES marker scenarios and all SRES scenarios. The distinction
in scenario groups is related to the energy system and is thus not relevant
in this section.
As discussed further in Chapter 5, model treatment of
land-use change and base-year parameterization differ substantially. Therefore,
comparisons between different models can yield substantial differences. Land-use
change assumptions for each of the marker scenarios are described below. More
detailed inter-model comparisons of land-use change and emissions models, as
well as a deeper analysis of potentials and rates of change of main driving
force variables, such as agricultural productivity growth and dietary changes,
remain an important area for future research.
| Table 4- 17: Global land cover in 1990, and land-
use changes between 1990 and 2050, and 2050 and 2100 (in million ha) for
the four SRES marker scenarios, and ranges across all four scenario families
for all SRES scenarios (minimum and maximum in brackets). In particular,
the different model representations of related processes among the various
models are shown. MESSAGE (B2 marker) does not include a land- use change
and related GHG emissions module, ASF (A2 marker) models changes in carbon
fluxes only, whereas AIM and IMAGE (A1 and B1 markers, respectively) model
both land- use changes and related emissions. Ap propriate land- use change
and emission scenarios calculated with alternative models with consistent
socio- economic driving- force assumptions have been adopted for the corresponding
scenarios based on the judgment of the individual modeling teams that developed
the respective marker scenarios. In these cases (A2 and B2), land- use change
scenarios represent first- order approximations only. |
|
| |
Land-Use
(million ha)
|
Land-Use Change (million ha)
|
| |
|
| |
1990-2050
|
1990-2100
|
|
| Type |
1990
|
A1
|
A2
|
B1
|
B2
|
A1
|
A2
|
B1
|
B2
|
|
| Cropland |
1434- 1472
|
-17
(- 113, +904)
|
n. a.
=(- 187, +267)
|
-7
(- 305, +461)
|
167
(- 49, 628)
|
-39
(- 826, -39)
|
n. a.
(- 422, +420)
|
325
(- 979, -30)
|
-394
(- 582, 325)
|
| Grassland |
3209- 3435
|
109
(- 794, +1714)
|
n. a.
(+ 194, +1218)
|
-650
(- 650, +1335)
|
155
(- 491, +1331)
|
188
(- 1087, +622)
|
n. a.
(+ 313, +1262)
|
-1537
(- 1537, +320)
|
307
(- 491, +823)
|
| Energy Biomass |
0- 8
|
418
(+ 12, +745)
|
n. a.
(+ 18, +311)
|
263
(0, +260)
|
288
(0, +288)
|
495
(+ 3, +1932)
|
n. a.
(+ 67, +396)
|
196
(0, +1095)
|
307
(+ 4, +597)
|
| Forests |
4138- 4296
|
-106
(- 1146, +175)
|
n. a.
(- 778, +302)
|
274
(- 667, +274)
|
57
(- 732, +57)
|
-92
(- 464, +480)
|
n. a.
(- 673, -19)
|
1260
(274, +1266)
|
227
(- 116, +227)
|
| Others |
3805- 4310
|
-405
(- 1072, +15)
|
n. a.
(- 833, -431)
|
122
(- 579, +122)
|
-667
(- 667, -98)
|
-552
(- 873, +566)
|
n. a.
(- 1085, -278)
|
482
(- 983, -482)
|
-1166
(- 1166, -137)
|
|
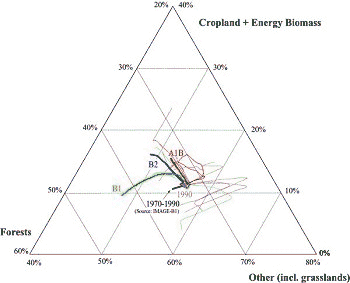
Figure 4-12: Global land-use patterns, shares
(%) of croplands and energy biomass, forests, and other categories including
grasslands - historical development from 1970 to 1990 (based on B1-IMAGE)
and in SRES scenarios. As for the energy triangle in Figure
6-3, each corner corresponds to a hypothetical situation in which
land use is dedicated to a much greater extent than today to one category
- 60% to cropland and energy biomass at the top, 80% to forests to the
left, and 80% to other categories (including grasslands) to the right.
Constant shares in total land area of cropland and energy biomass, forests,
and other categories are denoted by their respective isoshare lines. For
1990 to 2100, alternative trajectories are shown for the SRES scenarios.
The three marker scenarios A1B, B1, and B2 are shown as thick colored
lines, and other SRES scenarios as thin colored lines. The ASF model used
to develop the A2 marker scenario projects only land-use change related
GHG emissions. Comparable data on land cover changes are therefore not
available.The trajectories appear to be largely model specific and illustrate
the different views and interpretations of future land-use patterns across
the scenarios (e.g. the scenario trajectories on the right that illustrate
larger increases in grasslands and decreases in cropland are MiniCAM results).
|
4.4.9.1. A1 Scenarios
In the AIM model, land-use changes at the beginning of the 21st century follow
largely historical trends. Over longer time horizons, the assumption is that
land-use changes are driven primarily by economic forces, consistent with the
A1 scenario storyline. Expected land rents and agricultural prices determine
long-run land-use changes, based on an equilibrium approach of international
agricultural markets. The AIM land-use model is linked to the AIM energy module
via biomass energy demand. In the A1 scenario, the rapid increase in the demand
for biomass energy raises the expected rent of biomass farmland. Reduction in
forest area occurs until 2020 because of population growth and rapid increases
of meat demand in the developing countries. Rising meat demands also result
in a substantial expansion of grasslands and pasture. However, high incomes
in scenario A1 also increase the demand for environmental amenities. Hence,
"demand" for forests also increases with economic growth, and the expected rent
of forestland is assumed to increase after 2020. These rising rents reduce the
rate of deforestation and increase the area of managed tree-covered land in
the latter half of the 21st century. Rising food productivity also counterbalances
the pressure on cropland and pastureland in the latter half of the 21st century.
For instance, crop productivity is assumed to grow on average by about 1.5%
per year in the A1 scenario family36.
However, despite these counterbalances the demand for pastureland continues
to increase throughout the 21st century because of the high income growth and
associated changes in diets. The resultant land-use changes for the A1 marker
scenario between 1990 and 2100 are:
- Largely stationary trend of global cropland areas (-39 million ha between
1990 and 2100, i.e., 3% of 1990 cropland areas).
- Decline in global forest cover by some 92 million ha.
- Increase of grasslands and biomass land-use of 188 and 552 million ha, respectively.
Land-use change patterns are more dynamic in the intermediate time periods,
and also display a wide variation across different regions.