We use cookies to imporve your experience. By using our site, you consent to our cookie policy Learn more
arrow arrow_up breadcrumb-chevron-right breadcrumb-home dropdown-arrow-down loader GALogoWUNEP GALogo2018 GALogo2019 menu read-more-plus rrss-email rrss-facebook rrss-flickr rrss-instagram rrss-linkedin rrss-twitter rrss-vimeo rrss-youtube rrss_google_plus rrss_skype rrss_web pdf search share Completed In Process Ideas In Develpment Toogle Toogle Thumbnail View List View play close filter-collapse filter edit media_photo_library media_video_library graphics pictures videos collections next

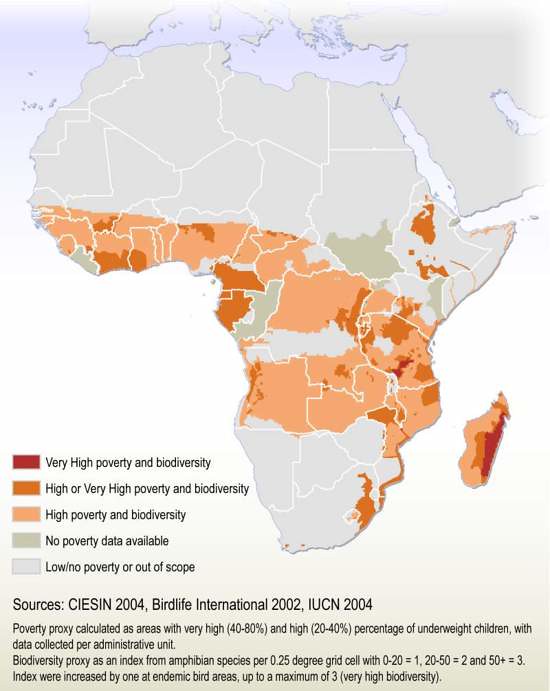
Relationship between biodiversity and poverty in Africa

This map may be used to show areas in which biodiversity is threatened in relation to poverty on a continental scale. Areas where high percentage of underweight children - used as a proxy for poverty - coincide with a high occurrence of amphibian species and endemic bird areas - a proxy for biodiversity - may indicate areas in which poor people likely have no other choice than the unsustainable extraction of resources, in turn threatening biodiversity.

Year: 2005

From collection: Poverty-biodiversity mapping applications

Cartographer: Hugo Ahlenius

Tags: Decision Graphic Support systems

Graphics included in same album

View all media