We use cookies to imporve your experience. By using our site, you consent to our cookie policy Learn more
arrow arrow_up breadcrumb-chevron-right breadcrumb-home dropdown-arrow-down loader GALogoWUNEP GALogo2018 GALogo2019 menu read-more-plus rrss-email rrss-facebook rrss-flickr rrss-instagram rrss-linkedin rrss-twitter rrss-vimeo rrss-youtube rrss_google_plus rrss_skype rrss_web pdf search share Completed In Process Ideas In Develpment Toogle Toogle Thumbnail View List View play close filter-collapse filter edit media_photo_library media_video_library graphics pictures videos collections next

Norwegian emissions of greenhouse gases, 1985-1996

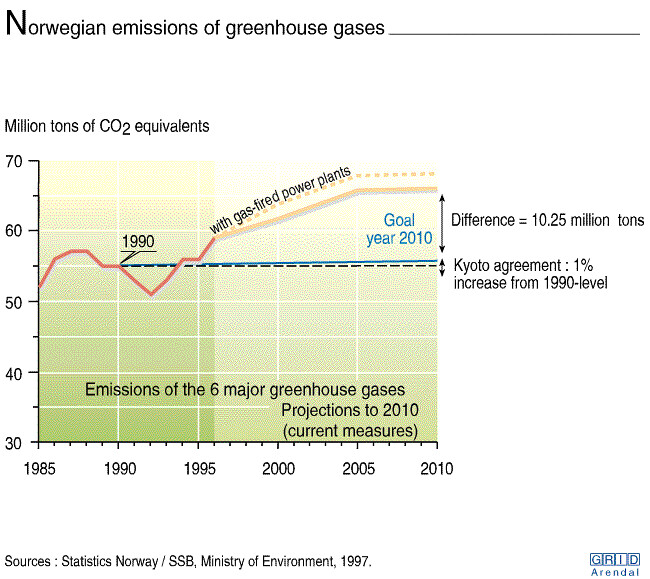
The graph shows the total emission of 6 major greenhouse gases in Norway from 1985 to 1996 with projections to 2010. Greenhouse gases are largely produced through human activities including industrial processes, fossil fuel combustion, and changes in land use, such as deforestation.

Year: 2005

From collection: State of the Environment Norway 98

Cartographer: Philippe Rekacewicz, Emmanuelle Bournay

Tags: Graphic Maps

Graphics included in same album

View all media