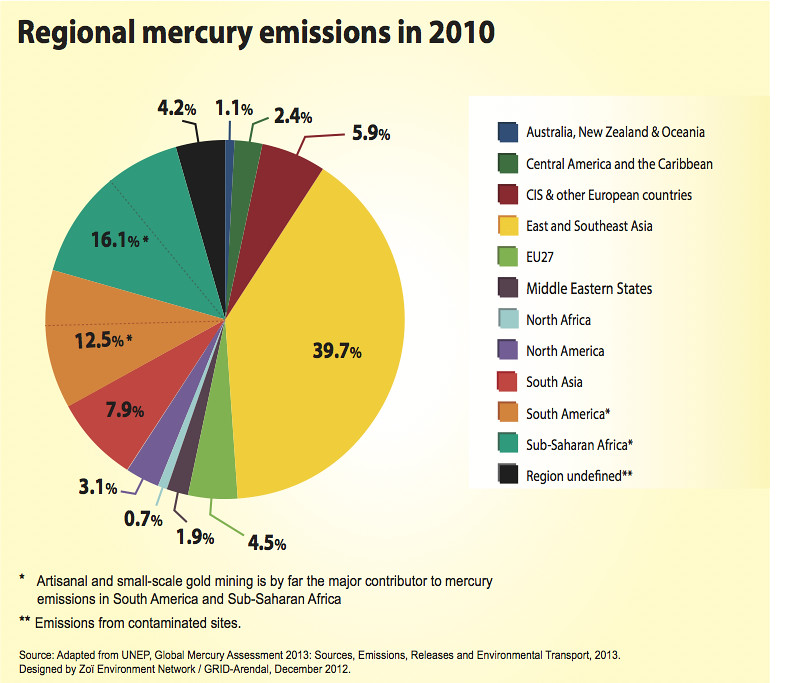
Regional mercury emissions in 2010
Global emissions of mercury to the air in 2010 from human activities were estimated at 1,960 tonnes. Although it is difficult to compare emissions estimates for individual years, total anthropogenic emissions of mercury to the atmosphere appear to have been relatively stable from 1990 to 2010 (UNEP, 2013). There has been a large shift in regional patterns, however. Economic growth has driven an increase in anthropogenic emissions in Southern and Eastern Asia, which now account for about half of global emissions. Emissions in Sub-Saharan Africa and in South America are slowly rising (together accounting for about 30 per cent of global emissions), while emissions are declining in North America and Europe (about eight per cent of global emissions altogether) (UNEP, 2013).
Year: 2013
From collection: Mercury - Time to act
Cartographer: GRID-Arendal