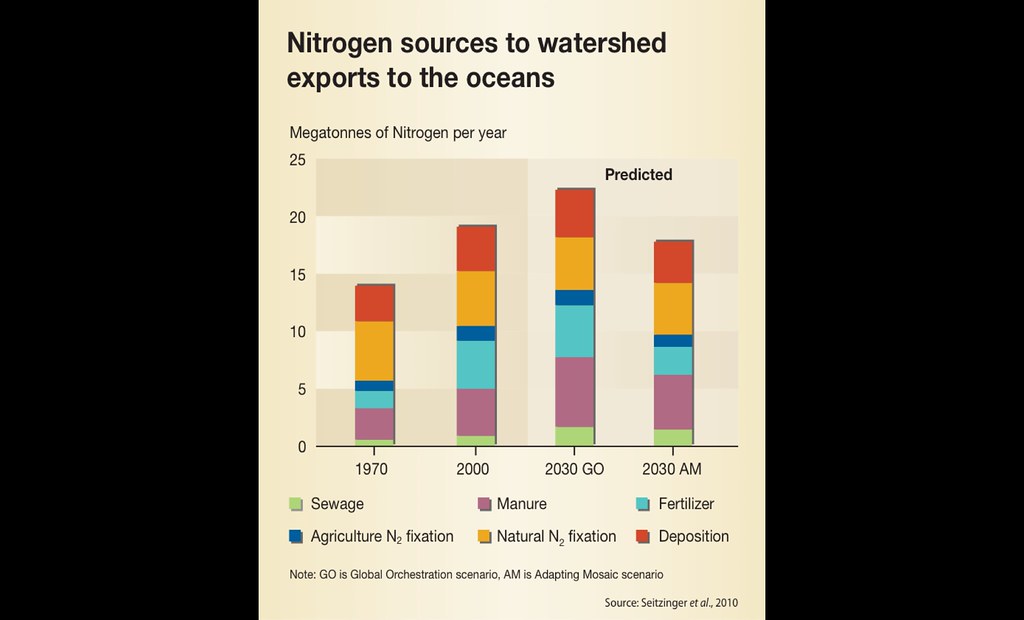
Nitrogen sources to watershed exports to the oceans
Over the last 20 years, significant data and experience in understanding and addressing the sectoral drivers, pressures, sources, impacts and response to reactive nitrogen have been gathered and progress made in trying to address these issues. The key sectors that are involved include the agriculture, waste-water management, and fertilizer production sectors. As shown in the figure for the year 2000, models indicate that globally, roughly equal amounts of reactive nitrogen reach the oceans from fertilizer, manure and (dominantly anthropogenic) atmospheric deposition, with smaller fractions from sewage and agricultural nitrogen fixation.
Year: 2013
From collection: Green Economy in a Blue World - Full Report
Cartographer: GRID-Arendal