We use cookies to imporve your experience. By using our site, you consent to our cookie policy Learn more
arrow arrow_up breadcrumb-chevron-right breadcrumb-home dropdown-arrow-down loader GALogoWUNEP GALogo2018 GALogo2019 menu read-more-plus rrss-email rrss-facebook rrss-flickr rrss-instagram rrss-linkedin rrss-twitter rrss-vimeo rrss-youtube rrss_google_plus rrss_skype rrss_web pdf search share Completed In Process Ideas In Develpment Toogle Toogle Thumbnail View List View play close filter-collapse filter edit media_photo_library media_video_library graphics pictures videos collections next

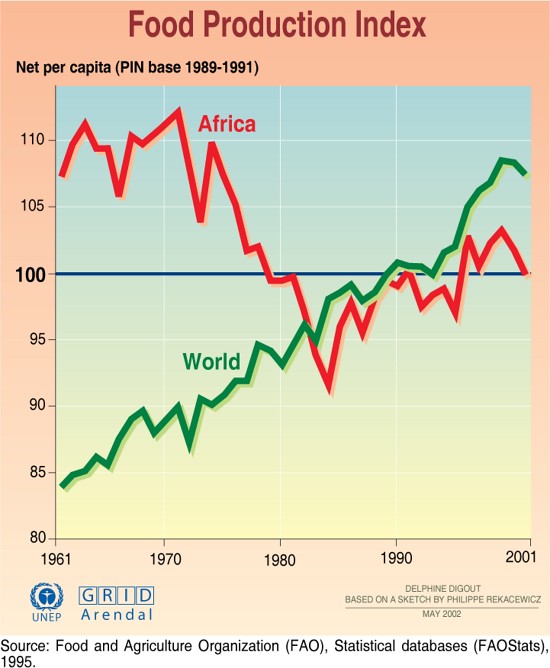
Food Production Index

Per capita food production is declining in Africa, but it is increasing steadily in the world as a whole. This graphic shows the net food production per capita (PIN base 1989-1991) for Africa and for the world for the time period 1961 to 2001.

Year: 2005

From collection: Vital Climate Graphics Africa

Cartographer: Cartografare il Presente/Nieves Izquierdo

Graphics included in same album

View all media

Publications it appears in

View all publications