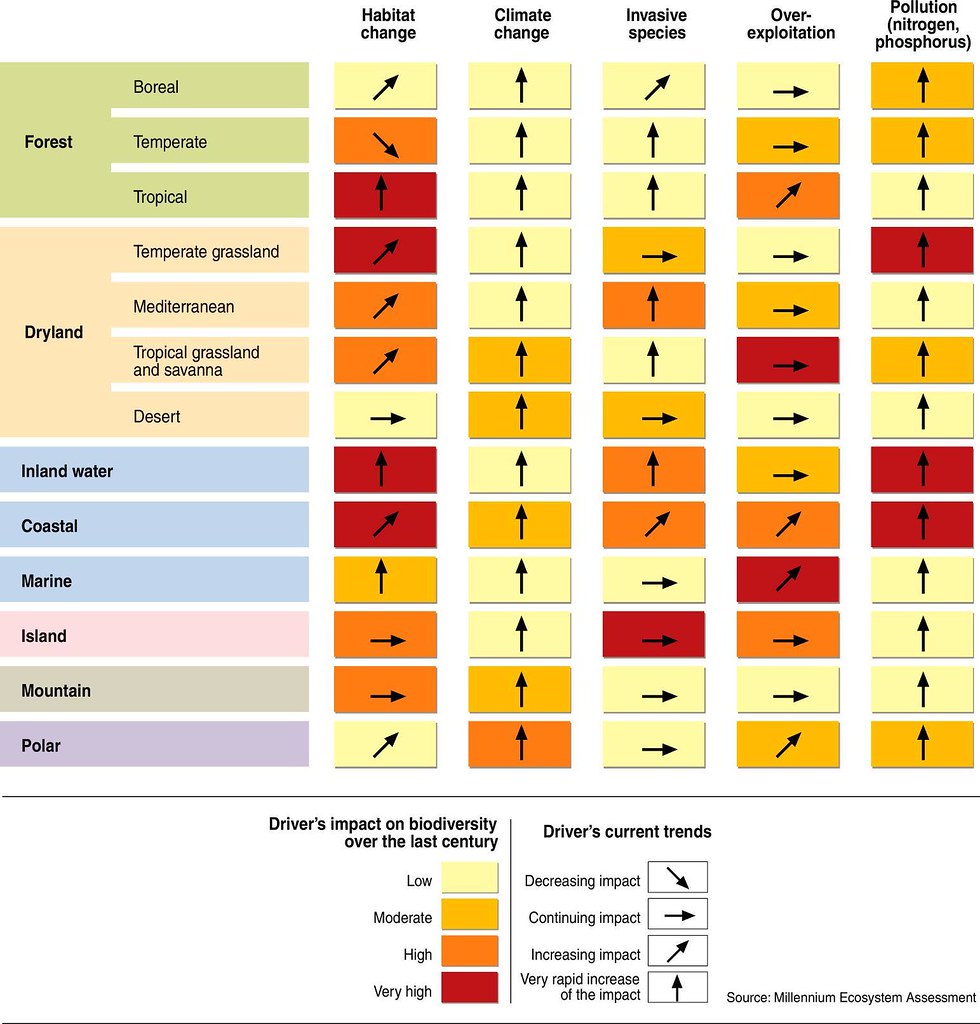
Main direct drivers of change in biodiversity and ecosystems (CWG)
The cell color indicates impact of each driver on biodiversity in each type of ecosystem over the past 50–100 years. High impact means that over the last century the particular driver has significantly altered biodiversity in that biome; low impact indicates that it has had little influence on biodiversity in the biome. The arrows indicate the trend in the driver. Horizontal arrows indicate a continuation of the current level of impact; diagonal and vertical arrows indicate progressively increasing trends in impact.
Year: 2007
From collection: Millennium Ecosystem Assessment
Cartographer: Philippe Rekacewicz, Emmanuelle Bournay, UNEP/GRID-Arendal