We use cookies to imporve your experience. By using our site, you consent to our cookie policy Learn more
arrow arrow_up breadcrumb-chevron-right breadcrumb-home dropdown-arrow-down loader GALogoWUNEP GALogo2018 GALogo2019 menu read-more-plus rrss-email rrss-facebook rrss-flickr rrss-instagram rrss-linkedin rrss-twitter rrss-vimeo rrss-youtube rrss_google_plus rrss_skype rrss_web pdf search share Completed In Process Ideas In Develpment Toogle Toogle Thumbnail View List View play close filter-collapse filter edit media_photo_library media_video_library graphics pictures videos collections next

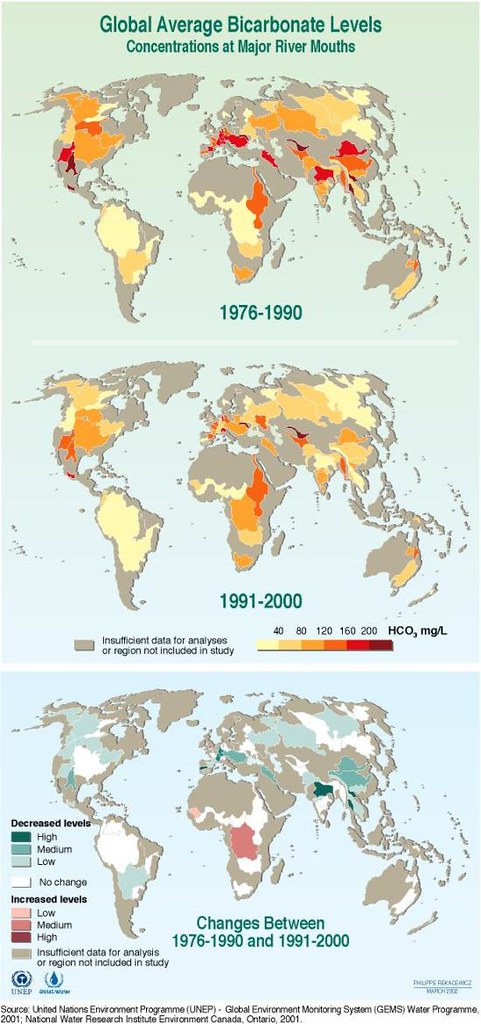
Global Average Bicarbonate Levels

This graphic shows the average bicarbonate concentrations, in milligrams per litre, at major river mouths for the time periods 1976 to 1990 and 1991 to 2000. The graphic also shows the changes in average bicarbonate levels between these two time periods. Bicarbonate is an indication of the alkalinity in the rivers which reflects the geology (rock, minerals, sand) and increases the buffering capacity, but can also increase the risk of eutrophication (excess nutrients).

Year: 2005

From collection: Vital Water Graphics

Cartographer: Philippe Rekacewicz, Delphine Digout, UNEP/GRID-Arendal

Tags: graphicsmaps recoursces!

Graphics included in same album

View all media