We use cookies to imporve your experience. By using our site, you consent to our cookie policy Learn more
arrow arrow_up breadcrumb-chevron-right breadcrumb-home dropdown-arrow-down loader GALogoWUNEP GALogo2018 GALogo2019 menu read-more-plus rrss-email rrss-facebook rrss-flickr rrss-instagram rrss-linkedin rrss-twitter rrss-vimeo rrss-youtube rrss_google_plus rrss_skype rrss_web pdf search share Completed In Process Ideas In Develpment Toogle Toogle Thumbnail View List View play close filter-collapse filter edit media_photo_library media_video_library graphics pictures videos collections next

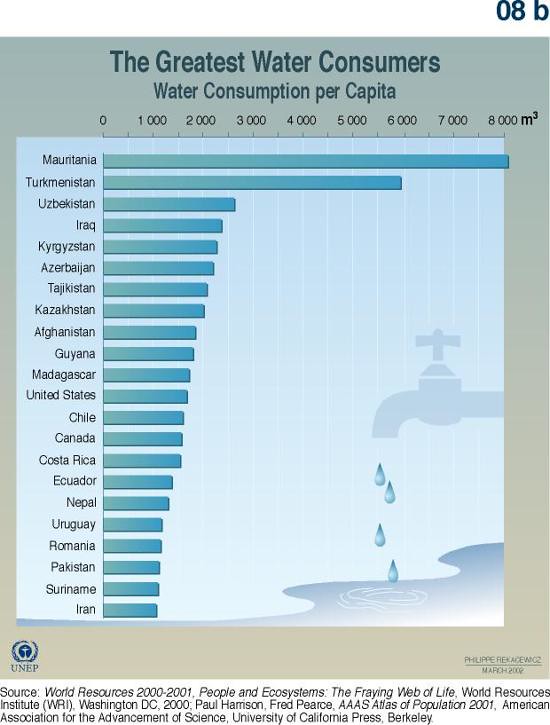
The Greatest Water Consumers

Freshwater use is partly based on several socio-economic development factors, including population, physiography, and climatic characteristics. This graphic illustrates the world's top 20 water consumers per capita, in cubic metres, which signify which countries are more effective in using the water.

Year: 2005

From collection: Vital Water Graphics

Cartographer: Philippe Rekacewicz, Delphine Digout, UNEP/GRID-Arendal

Tags: graphicsmaps recoursces!

Graphics included in same album

View all media