We use cookies to imporve your experience. By using our site, you consent to our cookie policy Learn more
arrow arrow_up breadcrumb-chevron-right breadcrumb-home dropdown-arrow-down loader GALogoWUNEP GALogo2018 GALogo2019 menu read-more-plus rrss-email rrss-facebook rrss-flickr rrss-instagram rrss-linkedin rrss-twitter rrss-vimeo rrss-youtube rrss_google_plus rrss_skype rrss_web pdf search share Completed In Process Ideas In Develpment Toogle Toogle Thumbnail View List View play close filter-collapse filter edit media_photo_library media_video_library graphics pictures videos collections next

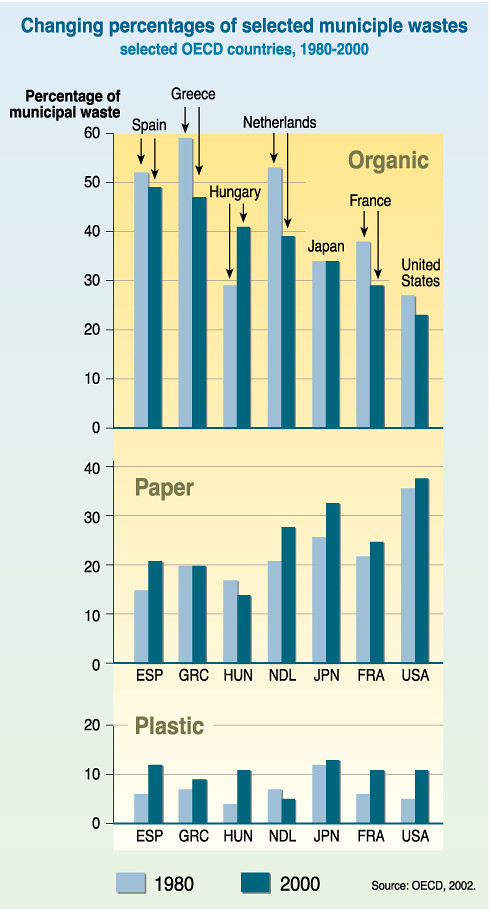
Changing percentages of selected municipal wastes

Municipal waste is everything collected and treated by municipalities. Only part of it is comes from households, the rest is generated by small businesses, commercial and other municipal activities. A typical trend: as countries get richer, the organic share decreases whereas the paper and plastic ones increase.

Year: 2005

From collection: Vital Waste Graphics

Cartographer: Philippe Rekacewicz, UNEP/GRID-Arendal

Tags: graphics

Graphics included in same album

View all media

Publications it appears in

View all publications