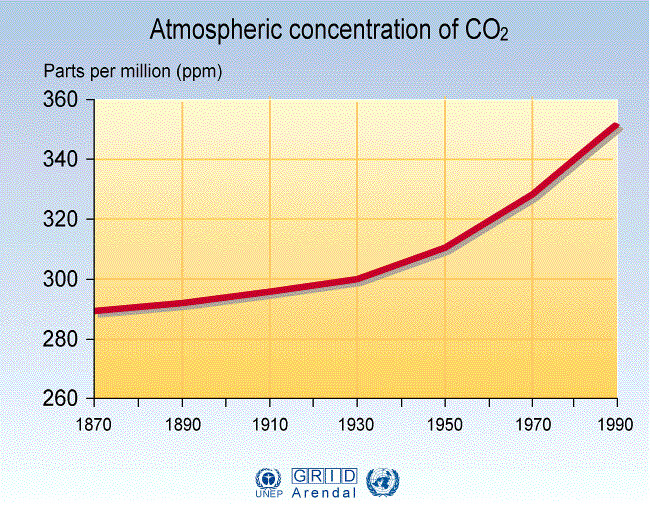
Atmospheric concentration of CO2, 1870-1990
Historically the developed countries of the world have emitted most of the anthropogenic greenhouse gases. The U.S. emits most in total, and is one of the countries with highest emissions per capita. China is the second largest emitter, but has very low emissions per capita. Over the last 20 years, industrial development has led to a rapid rise in the volume of emissions from Asia, but on a per capita basis, emissions in this region are still at the bottom of the global scale. This graph shows the global atmospheric concentration of CO2 from 1870 to 1990.
Year: 2005
From collection: General Archive
Cartographer: GRID-Arendal