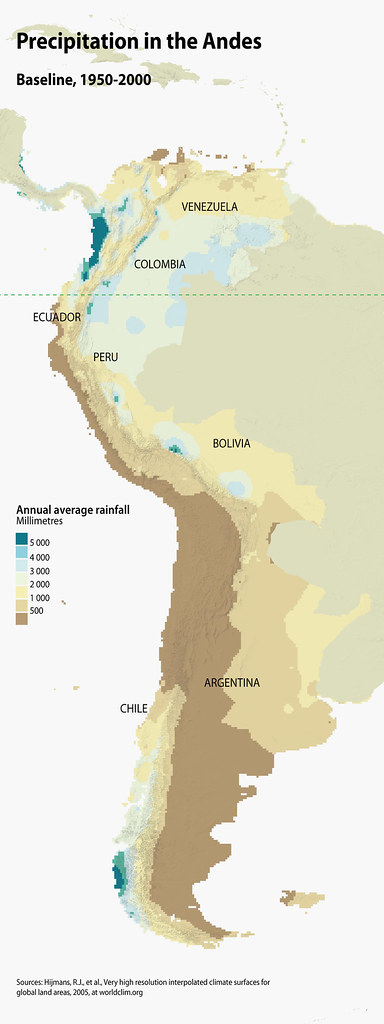
Precipitation in the Andes
Precipitation trends in the Andes are difficult to identify, due to the lack of reliable long-term observational records and the generally high variability in annual precipitation (Vuille et al., 2018). A number of studies reveal an intensification of rainfall, as opposed to an increase in frequency or duration of wet days, basically translating in a change in seasonality and an increase in extreme rainfall events (e.g. de los Milagros Skansi et al., 2013; Castino et al., 2017; Vuille et al., 2018). However, yearly precipitation can vary markedly with both severe reduction or increase in annual volumes, depending on location and influenced by ENSO events (e.g. Heidinger et al., 2018; Ruiz et al., 2017; Lenaerts et al., 2014; Garreaud, 2009).
Year: 2019
From collection: The Andean Glacier and Water Atlas
Cartographer: Riccardo Pravettoni